Performance Analysis
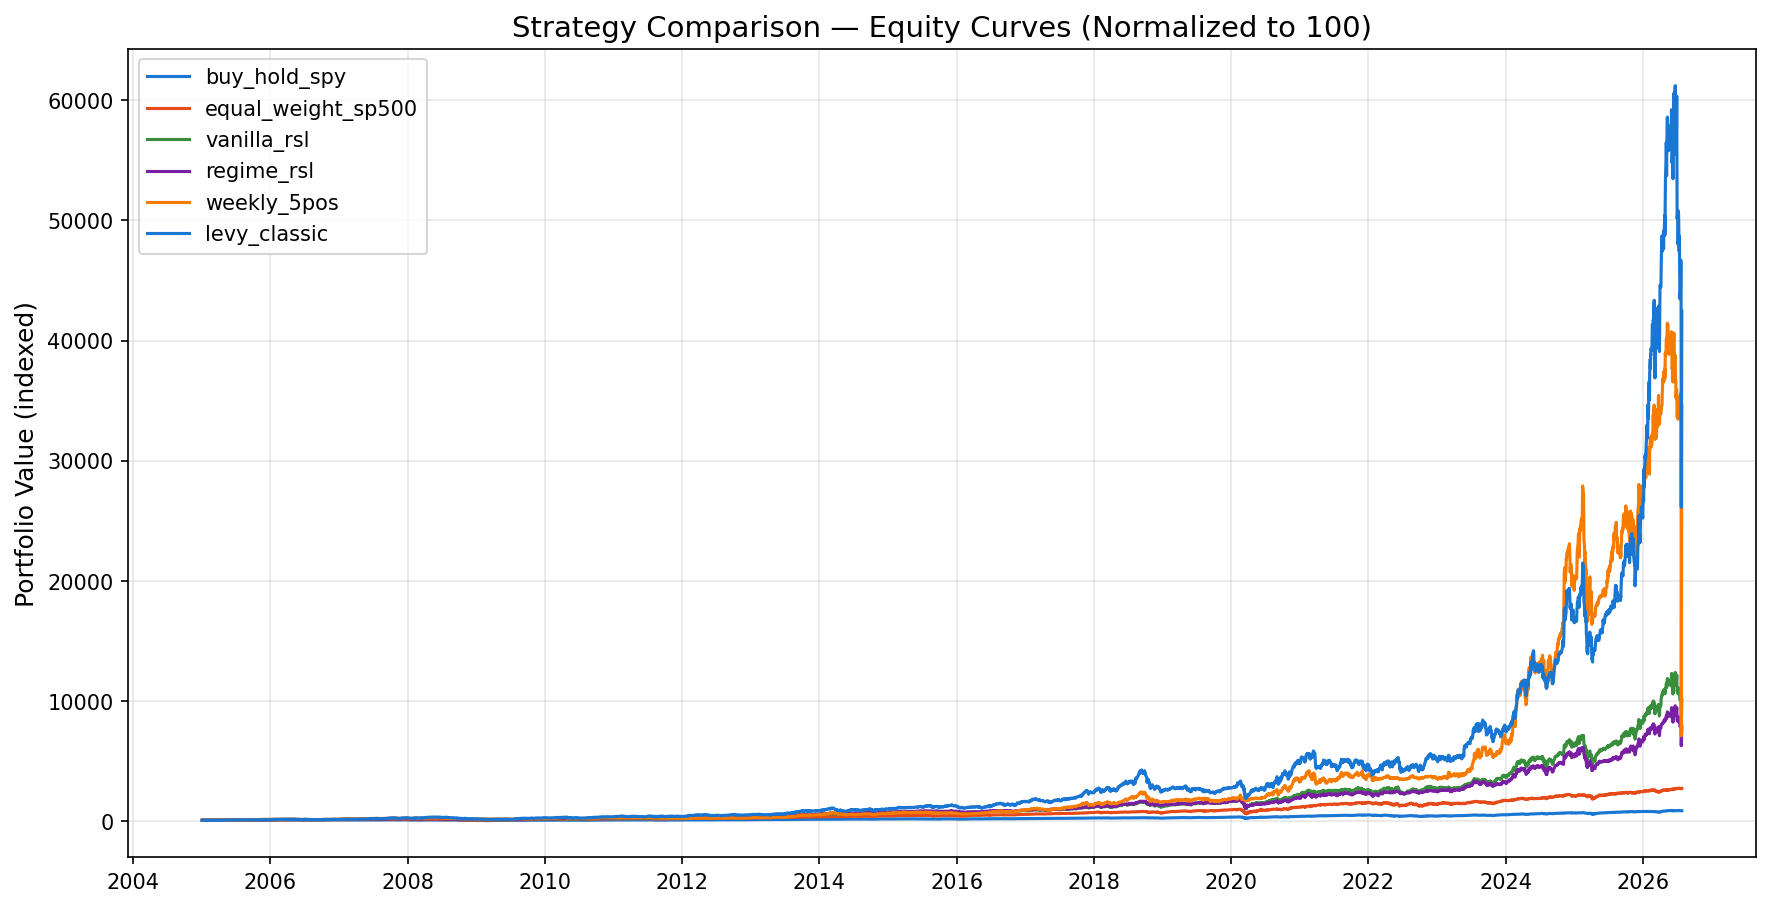
Equity Curves Comparison
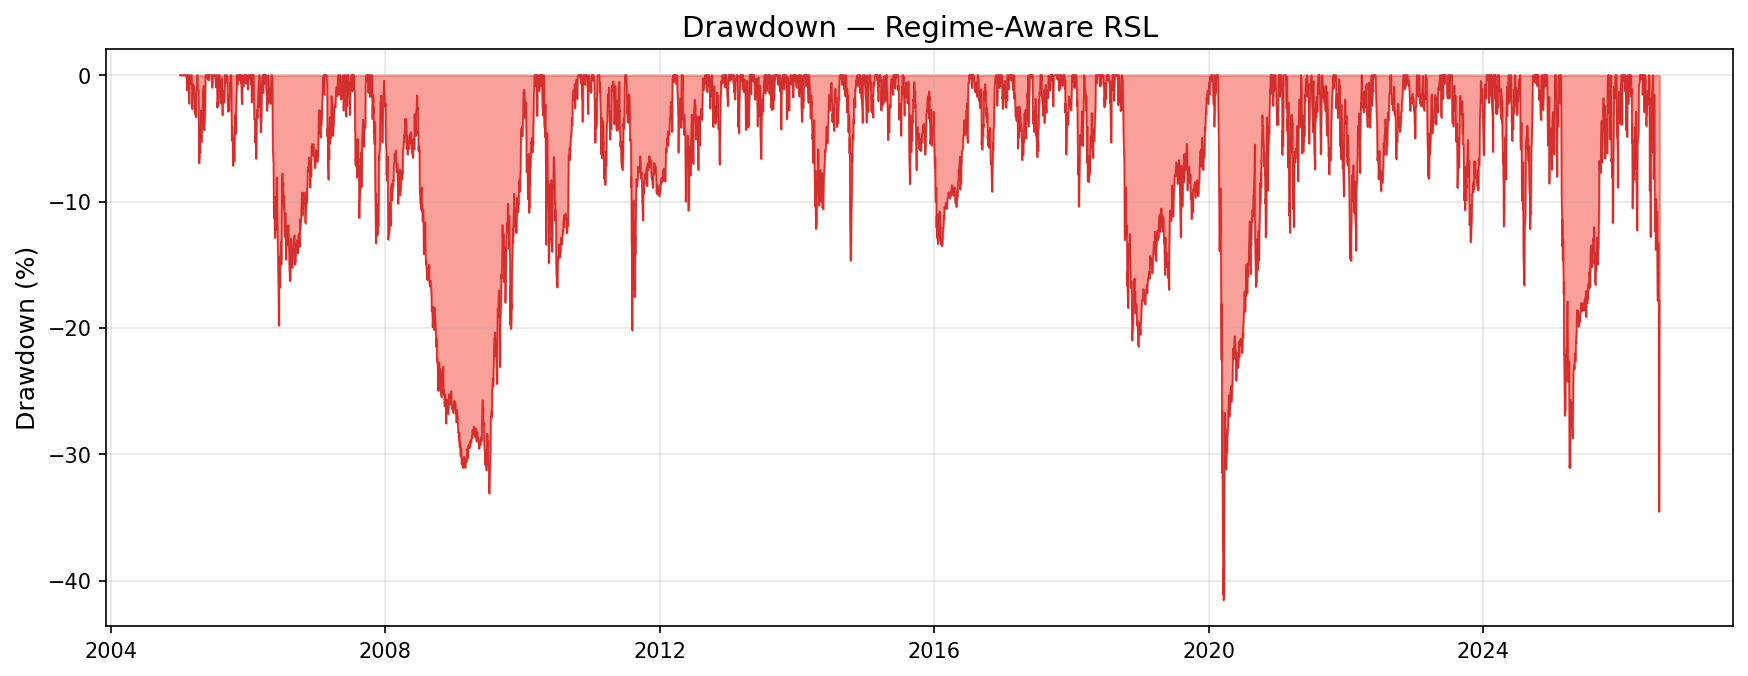
Drawdown — Regime RSL
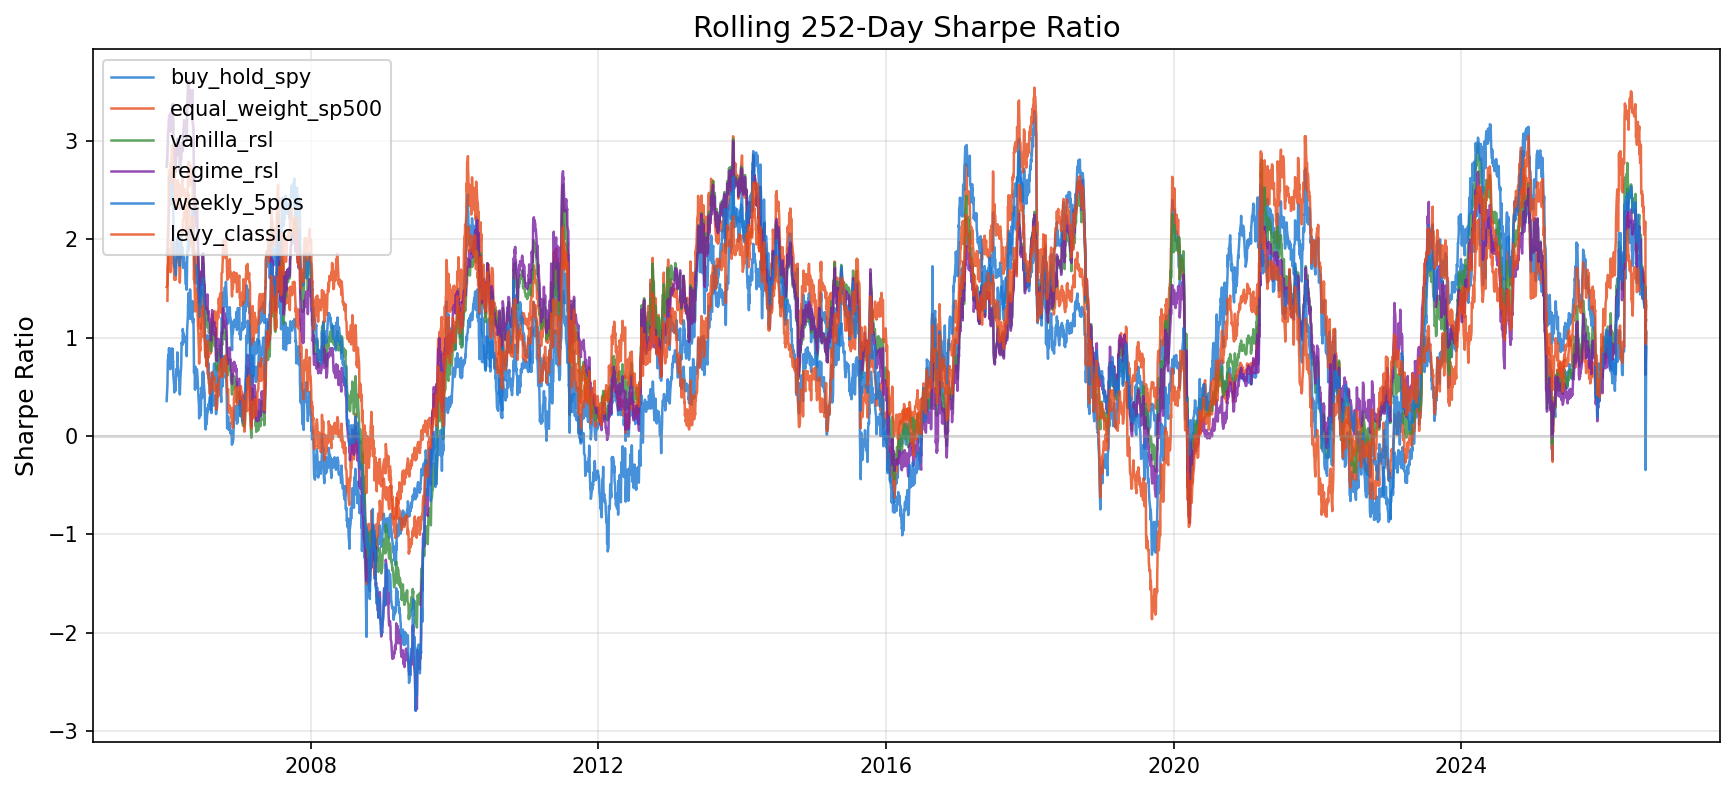
Rolling Sharpe Ratio
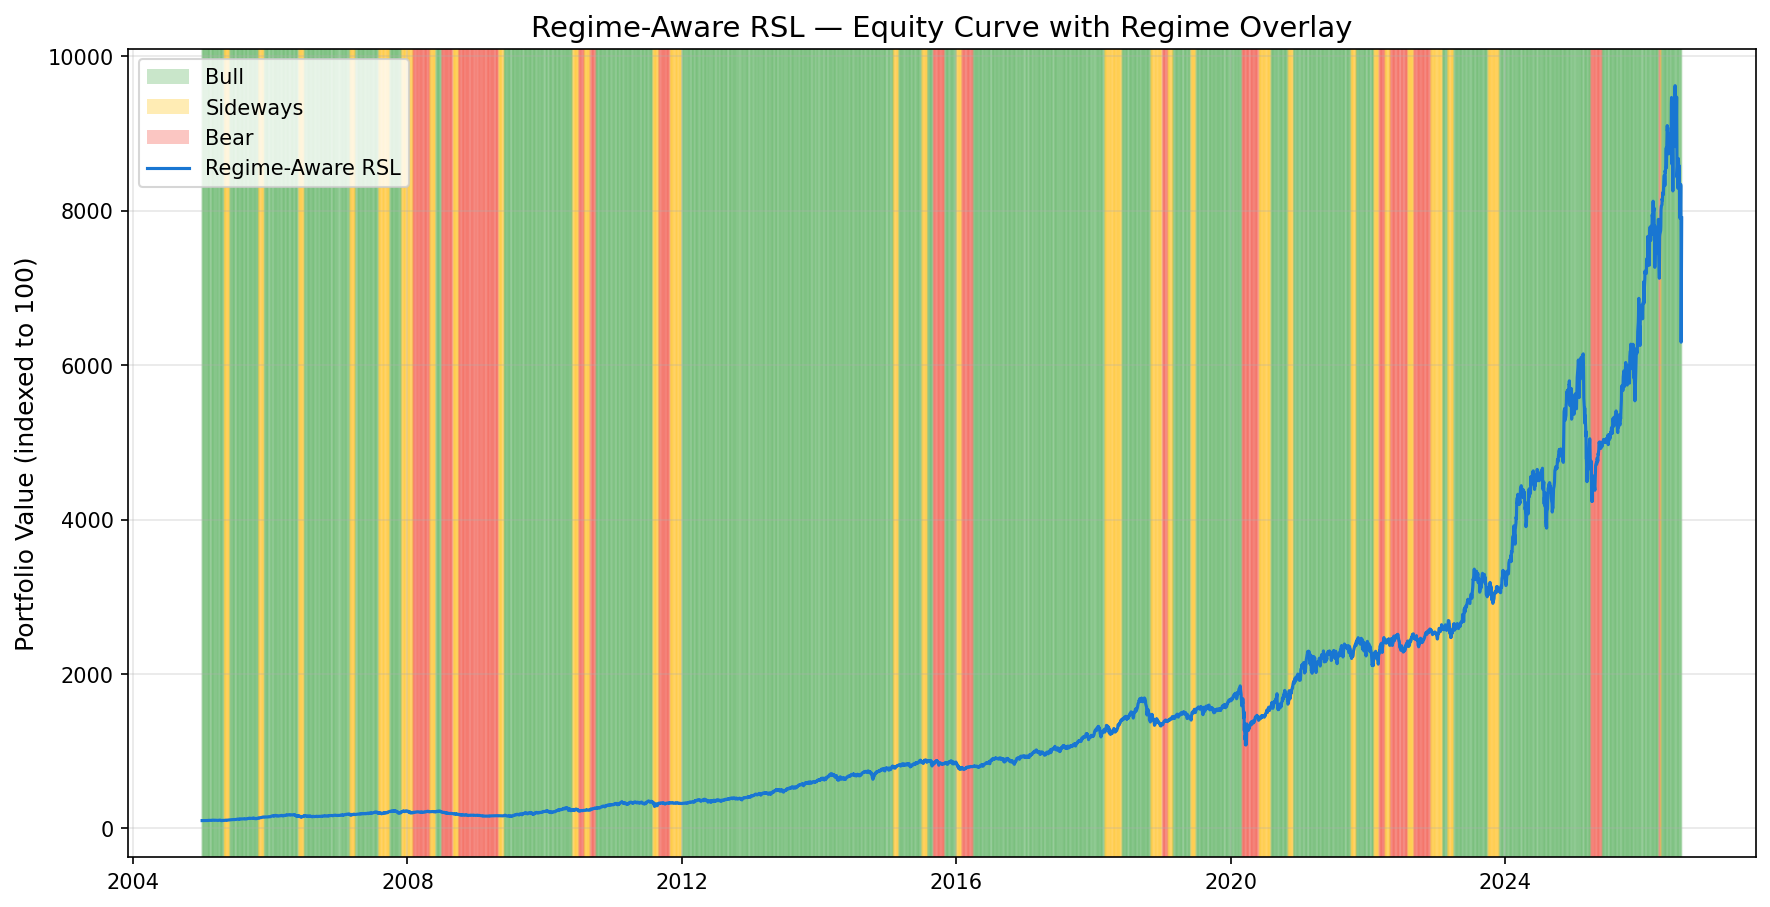
Equity with Regime Overlay
Performance Metrics Comparison
| Metric | levy_classic (#551) |
weekly_5pos (#550) |
regime_rsl (#549) |
vanilla_rsl (#548) |
equal_weight_sp500 (#547) |
buy_hold_spy (#546) |
|---|---|---|---|---|---|---|
| Cagr | 32.40% | 31.15% | 22.47% | 23.88% | 16.61% | 10.67% |
| Annual Volatility | 37.76% | 89.84% | 22.99% | 25.55% | 20.19% | 18.63% |
| Sharpe Ratio | 0.8798 | 0.4876 | 0.9124 | 0.8901 | 0.7613 | 0.5310 |
| Sortino Ratio | 1.1633 | 1.3204 | 1.1047 | 1.0958 | 0.9369 | 0.6510 |
| Max Drawdown | -57.28% | -82.82% | -41.55% | -44.92% | -50.69% | -54.24% |
| Calmar Ratio | 0.5656 | 0.3761 | 0.5408 | 0.5315 | 0.3277 | 0.1967 |
| Win Rate Monthly | 64.48% | 59.85% | 67.18% | 66.80% | 67.57% | 66.02% |
| Avg Monthly Return | 2.80% | 2.61% | 1.83% | 1.97% | 1.39% | 0.94% |
| Best Month | 32.91% | 42.57% | 18.31% | 19.77% | 17.43% | 12.59% |
| Worst Month | -30.55% | -28.34% | -18.23% | -18.13% | -18.29% | -16.14% |
| Annual Turnover | 689.02% | 2,219.83% | 769.65% | 804.31% | 0.00% | 0.00% |
| Total Return | 42,336.70% | 34,505.80% | 7,807.37% | 10,011.65% | 2,645.52% | 789.25% |